There have been many studies examining the effects of lives saved since the adoption of the WHO FCTC and its MPOWER measures. The recent one, published in Tobacco Control by Husain et al, explored two issues:
First, how effective are interventions such as MPOWER in achieving our shared goal of a smoke-free world?
Second, can simple composite measures help us measure how well individual countries are doing?
These are important questions, because we are seeing differential outcomes in clusters of specific countries – and we need to understand these differences to make our best impact on global public health. At the same time, work like this opens an important dialogue on HOW we measure these outcomes. Here are our thoughts on how to make these metrics more reflective.
Understanding MPOWER
MPOWER is an acronym for a subset of WHO FCTC’s demand reduction measures, developed by WHO to track its impact on tobacco consumption, prevalence, and tobacco-attributable deaths. One study by Levy and colleagues suggested that full implementation of MPOWER policies would reduce the number of smokers by 14.8 million (5.2%) in countries studied and prevent nearly 7.4 million (2.6%) smoking related deaths worldwide by 2050. In a recent paper examining the future of FCTC, Foundation President Derek Yach argues that, were the treaty’s provisions to be universally implemented, we would be much closer to a world free of tobacco-related diseases.
Husain et al examined the association between progress in MPOWER implementation from 2008 to 2016 and smoking prevalence from 2009 to 2017. The authors calculated a composite MPOWER score for each country in each study period, then categorized the countries in four initial conditions based on their level of MPOWER measures in place versus prevalence rates. They concluded that a decade after the introduction of the WHO MPOWER package, countries with higher initial tobacco control preparedness and a higher smoking burden – mostly developed or high-income countries – were able to reduce the adult daily smoking prevalence significantly.
This is not a surprising conclusion, as previous studies [1,2] have already argued that implementation of FCTC has been challenging in many low- and middle-income countries and has been slow, especially in several large countries. That said, it may be too soon to draw blanket conclusions about MPOWER levels and trends in country-specific smoking prevalence.
Our thoughts on tobacco control metrics
While this recent study on MPOWER effectiveness represents a good first start, it also reflects the need for future metrics that tie in more accurately with ground-level cessation results in specific countries. Here are some of our observations:
Composite MPOWER levels don’t tell us much
In order to monitor a country’s tobacco control efforts, it can be useful to create the MPOWE and MPOWER indices, which give equal weight to each indicator for a tobacco control measure. But the resulting indices will not necessarily be useful as explanatory variables in models of smoking prevalence.
In some cases, the highest reported success rates are for provisions that have the weakest impacts on ending tobacco use. For example, 52% of the world is “covered” with respect to pack warnings, which do little to reduce smoking rates. By comparison, looking at more effective measures, a recent WHO report (2019) noted that “only 23 countries provide cessation services at best-practice level (23% of countries) and 14% of countries apply best practice of tax policy (75% of total tax on retail price).” Both examples illustrate how a composite measure of equally-rated interventions could be misleading.
Adjusted data may obscure actual results
WHO already uses a number of assumptions, including predicting for missing years in country surveys, or using adjusted data from neighboring countries if no survey exists. Adjusting this data further for age and gender and then using them as a dependent variable may not paint a true picture of the results.
We need better measures of tax policy outcomes
Using total tax share (%) on the most popular brand, as was done in the recent MPOWER study, is a potentially misleading measure of the impact of tobacco tax policy, the “R” variable in MPOWER on smoking prevalence.
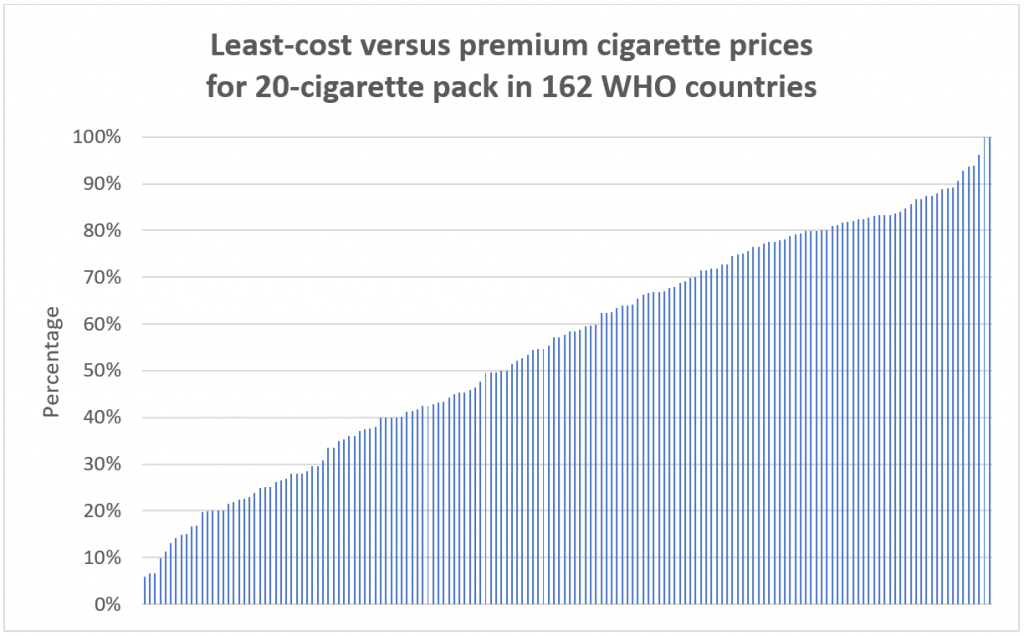
Consumers’ smoking behavior is influenced by how sensitive they are toward prices and price differences within and among tobacco products. For example, the figure below shows the price ratio between least-cost and premium cigarettes in 162 WHO countries. In one case (China), there is a spread ranging from US $0.44/pack to US $7.32/pack, and the global median represents a greater than 40% price differential.
Checking MPOWER price data from 2008-2018, we noticed that changes in total tax share do not necessarily reflect changes in cigarette prices in the same direction. In other words, there is no consistency for about 45% or 80 out of 187 WHO countries. There are cases where retail prices have changed in the opposite direction as taxes, changed as tax rates have stayed constant, or remained the same in the face of tax increases.
This means that in many countries, percentage tax rates may not reflect effectiveness in reducing smoking. Nargis et al (2019) noted that in Bangladesh, for example, its multi-tiered tax structure incentivized downward substitution to cheaper brands due to wider price differentials. She also notes upward substitution with increasing incomes, while Mukherjee and Ekanayake (2018) find modest effects to incremental tax increases, given factors such as limited elasticity of demand.
Governments with shares or monopoly positions in tobacco production often face disincentives to phase out combustible cigarettes or leverage tax policy to support harm reduction.
This brings us to a final comment on how WHO evaluates the impact of taxes. Currently, best practice is defined when the total tax share on retail price on most popular brand is 75% or higher. We feel this is a wrong assessment that can mislead studies using this benchmark in their analysis. Best practices for the R component in MPOWER need to be revised around factors such as specific versus ad valorem excise taxes, uniform versus tiered excise systems, differential excise tax application and incentives for harm reduction product use, as well as a focus on price differentials among smoking products.
Measuring effectiveness versus policy implementation
MPOWER-based measures often reflect the legislation of these policies – their book value, so to speak – but not their enforcement or public compliance. And despite a commitment to FCTC from 181 countries, cases where MPOWER measures have a low impact on adult prevalence suggests governments’ unwillingness or inability to enforce these policies. Perhaps these MPOWER measures need to be re-evaluated by WHO to better reflect their impacts on public health outcomes, not only the volume of legislation in place.
All of this underscores the need for continued research on what metrics ultimately drive effective policy outcomes. This is an important dialogue that we hope will move all of us closer to our shared goal of global smoking cessation.