
As a follow-up to our April 10, 2018, blog, entitled “Thoughts on ‘Why are the poor blamed and shamed for their deaths?’,” we explore the data associated with smoking and the cost of tobacco products over time. Taxation is a key demand-reduction measure of the WHO Framework Convention on Tobacco Control (FCTC), and taxes constitute a significant component of the cost of a pack of cigarettes in many countries. The analysis we conduct in this report focuses on the U.S. market and specifically on data provided by the Centers for Disease Control and Prevention (CDC), along with other sources at the state level.
Our analysis underscores the importance of cigarette pricing, driven by taxation, as a tool in the effort to reduce smoking prevalence and to promote smoking cessation. Linear regression analyses reveal, as expected, a statistically significant inverse relationship between smoking prevalence among both adults and youth and the average cost per pack of cigarettes. Multivariable models also demonstrate inverse relationships with economic growth and educational ranking factors at the state level. Importantly, we estimate that economic factors including price explain only a relatively small portion of the variability of the data as reflected by R-squared values. Not surprisingly, the dynamics between smoking prevalence and economically oriented variables differ somewhat across adult and youth smokers.
From a different perspective, the Foundation’s State of Smoking Survey global poll data show that 30% to 40% of smokers do not plan to quit smoking, regardless of cigarette price. While approximately 60% of smokers polled globally indicate they would stop smoking, reduce tobacco consumption, or switch to alternative products because of an increase in tobacco price, tobacco taxation alone is not sufficient to achieve a smoke-free world.
Furthermore, cigarette taxes are regressive, and the excess cost is often borne by the poor. According to the CDC, in a developed country such as the U.S., smoking is highly concentrated among those living below the poverty line, and those with poor educational attainment, psychiatric disorders, disabilities and other vulnerabilities. The results of our analyses support these observations.
Pricing explains a part of the smoking prevalence equation
According to WHO reports, sufficient tobacco taxation is still the least implemented measure in terms of population coverage of all WHO MPOWER measures. The total number of countries with best-practice taxation declined by two (from 34 in 2014 to 32 in 2016). With the CDC data at hand, we decided to explore the relationship between smoking prevalence and the average cost per pack of cigarettes based on the U.S. state data, with the following questions in mind:
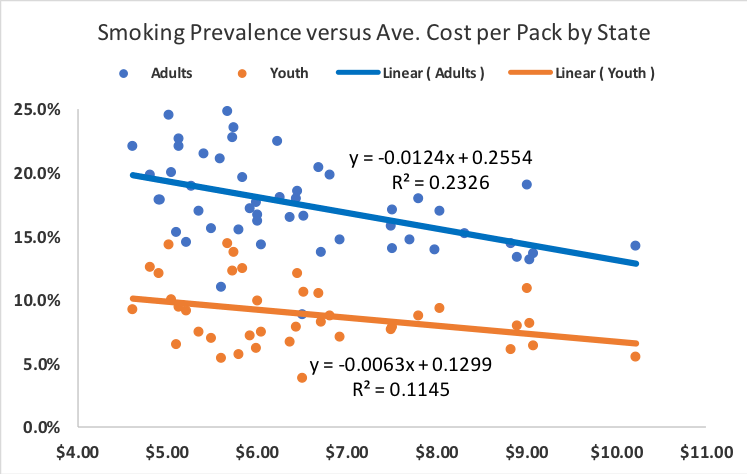
We find a statistically significant (95% confidence interval) inverse relationship between smoking prevalence and the average cost per pack of cigarettes in both adults (p = 0.000338) and youth (p = 0.035141), using available U.S. state data, as summarized in Chart 1. The variability of the response data around the mean is explained to a greater degree for adults compared with youth, as reflected by the respective R-squared values. That said, the R-squared values are relatively low.
Chart 1. Relationship Between Smoking Prevalence and the Average Cost per Pack by State
What is explained versus what is not explained by the analyses
We next applied linear regression analyses to CDC data sets dating back to the early 1990s for adult smokers and to the late 1990s for youth smokers. Results of the linear regression in current adult smokers predict pricing elasticity in the range of –0.33 to –0.50. Linear regression results of current youth smokers predict pricing elasticity in the range of –0.46 to –0.74.
Our primary observation pertains not only to what is explained by the linear regression analyses, but also to what is not explained by the analyses. For example, the maximum R-squared value of 24.2% for adult smokers over the period indicates that the average cost-per-pack model explains less than one-quarter of the variability of the response data around its mean. The maximum R-squared value of 30.3% for youth smokers over time indicates that the model explains less than one-third of the variability of the response data around its mean. Clearly, pricing has an important inverse relationship with smoking prevalence, but the relatively low R-squared values indicate the existence of additional explanatory factors, including FCTC demand-reduction measures. Research indicates that in the implementation of tobacco tax and price increase measures, progress has been much slower in this policy domain.
Focusing on factors in addition to the average cost per pack, our analyses show a statistically significant inverse relationship for smoking prevalence with per capita personal income percentage change (adults: p = 0.000569; youth: p = 0.000485) and education rank (adults: p = 0.000032; youth: p = 0.001032). Therefore, our model predicts that cigarette taxation disproportionately burdens the economically disadvantaged and the least educated in society. Importantly, even in the three-variable model, R-squared values remain relatively low. The R-squared values indicate that the models explain about 54.8% of the variability of the response data around its mean for adults and 48.4% for youth, implying about one-half of the explanatory power.
We identified additional factors in the form of multivariable linear regression analyses models for adults, such as the average price of a gallon of gasoline and cigarette-smuggling ranking at the state level. Some financial analysts believe high gas prices are a deterrent to cigarette sales, often at the point of purchase for cigarettes. Additionally, our model predicts that smoking prevalence is greater in smuggling exporter states than smoking importer states, reflecting price elasticity. Smoking exporter states have lower taxation than smoking importer states, by definition, thus creating the illicit trade arbitrage opportunity. Regression analyses did not find statistical significance for these two factors within the 95% confidence interval for youth smokers.
The recently issued Youth Risk Behavior survey states that the prevalence of current cigarette use decreased from 2015 (10.8%) to 2017 (8.8%). Our regression analyses for the most recent periods consistently show that the explanatory power of the economically oriented variables, as reflected by R-squared measures, for youth smokers is less than that for adult smokers. One potential interpretation is that youth smoking prevalence, while sensitive to pricing and therefore taxation, is explained to a lesser degree by economic factors compared with adult smoking prevalence in developed countries such as the U.S. Conversely, other noneconomic factors are potentially at work for youth. We would not generally extrapolate this relationship to developing countries.
What does our global poll say?
The Foundation’s State of Smoking Survey global poll data support our view that pricing is just one of the explanatory factors that determines smoking prevalence, albeit an important factor. The Foundation commissioned a poll that surveyed more than 17,000 subjects (smokers, ex-smokers and nonsmokers) in 13 countries, including the U.S. The following discussion is based on estimates, noting that variations exist from country to country.
Overall, we find that an estimated 30% to 40% of the smokers interviewed offered no indication of a desire to quit smoking.
Additional research
We believe the topic of taxation on tobacco products is ripe for the application of new analyses of existing data and for the collection and identification of new data.
First, we support the development of comprehensive smoking prevalence multivariable modeling to encompass applicable factors – such as tobacco product substitution, illicit trade, prevalence of e-cigarettes (particularly in the youth cohort) and more. In our view, the relevant measure of price elasticity is that of total tobacco consumption rather than only taxed cigarettes consumption.
Second, data collection has historically focused on the U.S. (as does this analysis) and certain European markets. We support the expansion of data collection to low- and middle-income countries. Data sets potentially include price elasticity of demand, consumer response to pricing differentials across tobacco products, taxation regressivity and the realistic assessment of the timing associated with related benefits and costs.
Finally, we believe that greater understanding of pricing, taxation and global consumer response across multiple demographics, countries and time is important in evaluating taxation policy as part of a comprehensive plan to incentivize users to move away from combustible tobacco products toward potentially lower-risk products. Advancing the holistic modeling of consumer behavior is a crucial prerequisite to developing policies with the appropriate pricing differentials that will encourage switching from combustible tobacco to reduced-harm products.